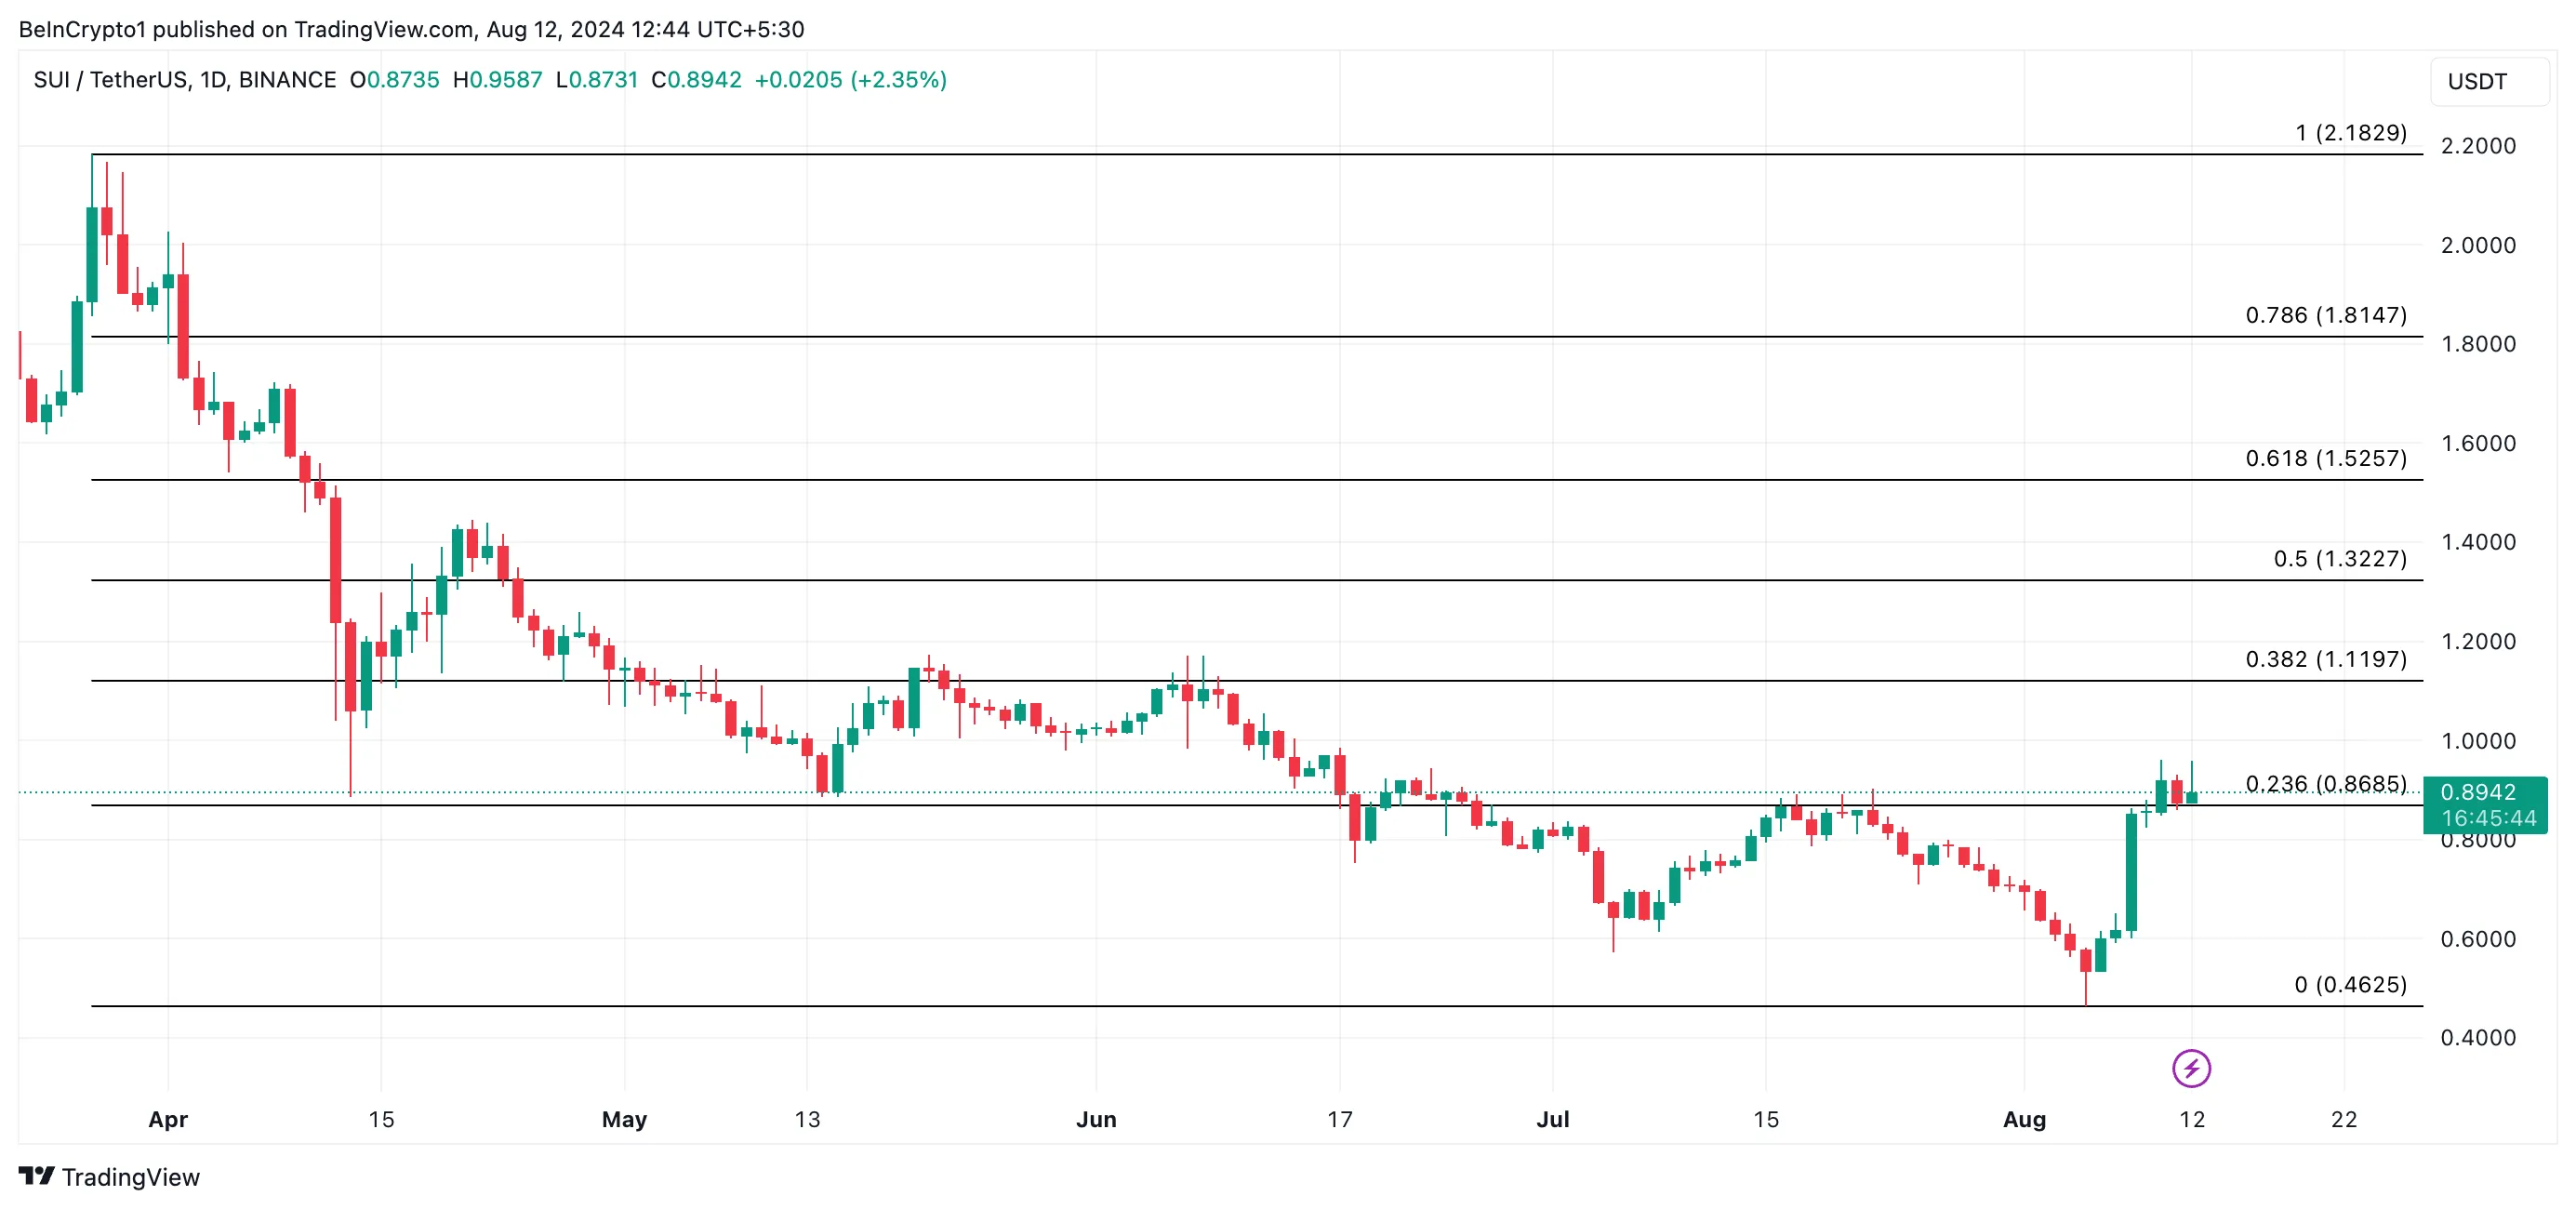
The value of SUI, the native coin of Layer-1 (L1) blockchain Sui Network, has witnessed an impressive price rally in the past week. Exchanging hands at $0.90 at press time, the altcoin’s price has climbed by 82% in the past seven days.
The altcoin is currently trading at its highest price over the past 30 days and is poised to extend its gains.
SUI Prepares to Extend its Gains
SUI has seen a surge in its trading activity over the past few days. In the last 24 hours alone, the coin’s daily trading volume has totaled $376 million, its highest since June 7, according to Santiment.
When an asset’s price and trading volume rally, it indicates increased interest and activity in that coin. The price growth often reflects higher demand for the coin, as more people are willing to buy it, therefore driving up its value.
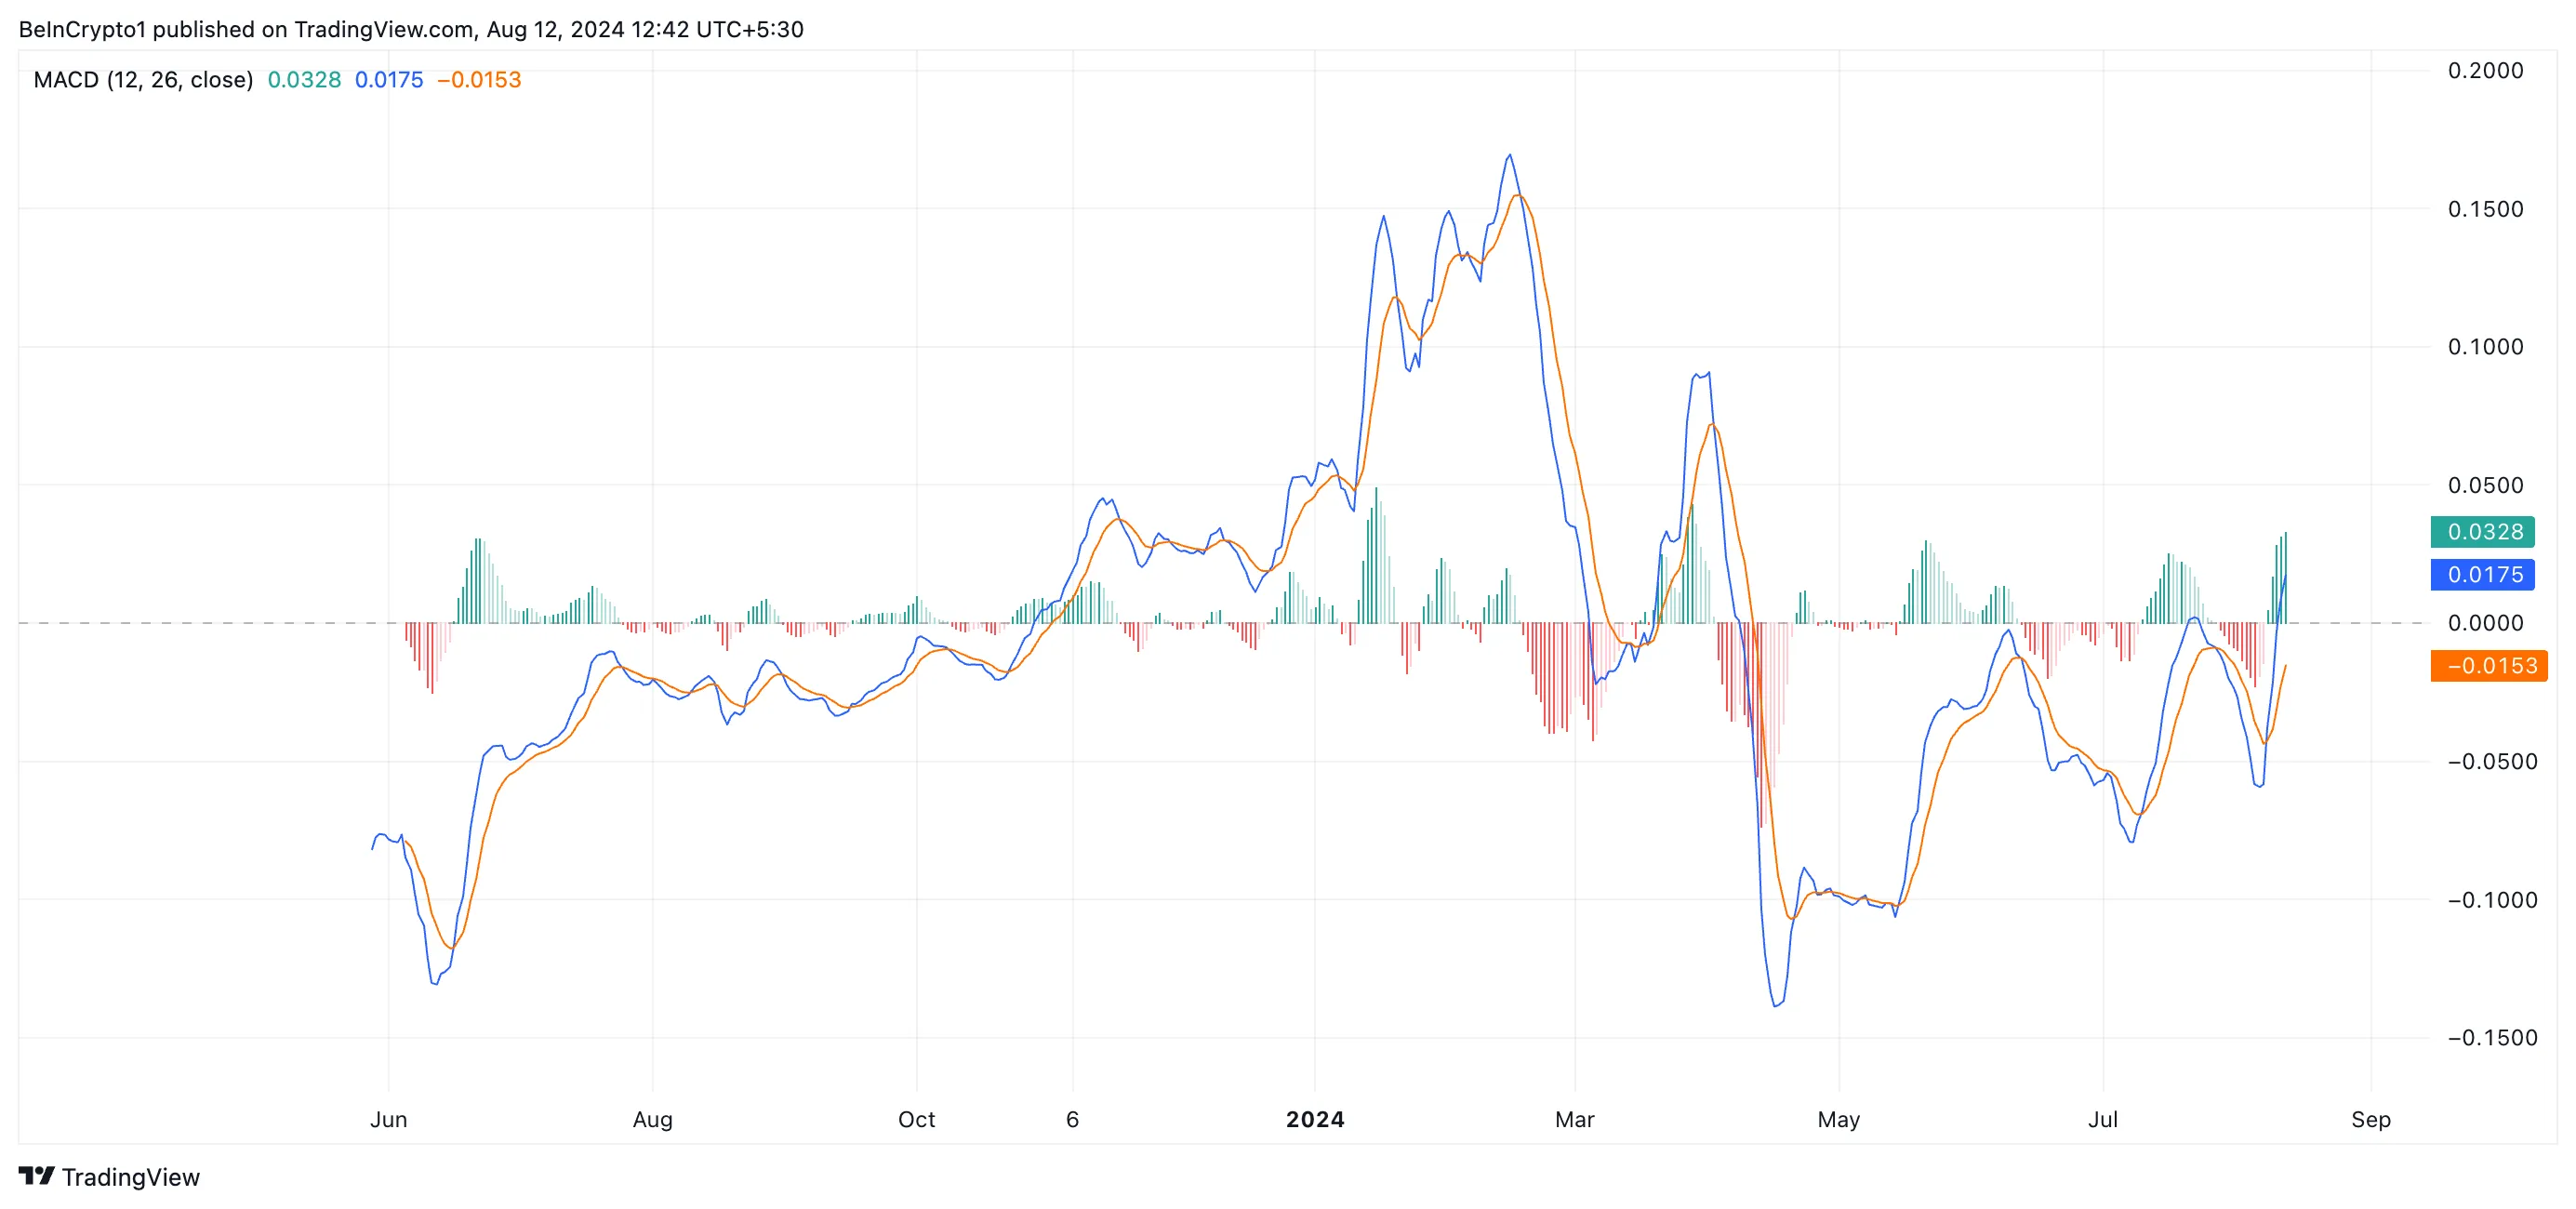
Further, SUI’s Moving Average Convergence/Divergence (MACD) indicator, as assessed on a one-day chart, confirms the uptick in the demand for the altcoin. At press time, readings from the indicator show its MACD line (blue) resting above the signal (orange) and zero lines.
Read more: 10 Best Altcoin Exchanges In 2024

The MACD indicator identifies an asset’s trend direction, shifts, and potential price reversal points. When the MACD line is above the signal line, it suggests that the short-term momentum is stronger than the long-term momentum. This often signals a good time to buy.
When the MACD line crosses above the zero line, it also confirms the uptrend and hints at the continuation of the rally. This means there is enough buying activity in the market to sustain the asset’s price growth.
SUI Price Prediction: Altcoin Targets $1.12
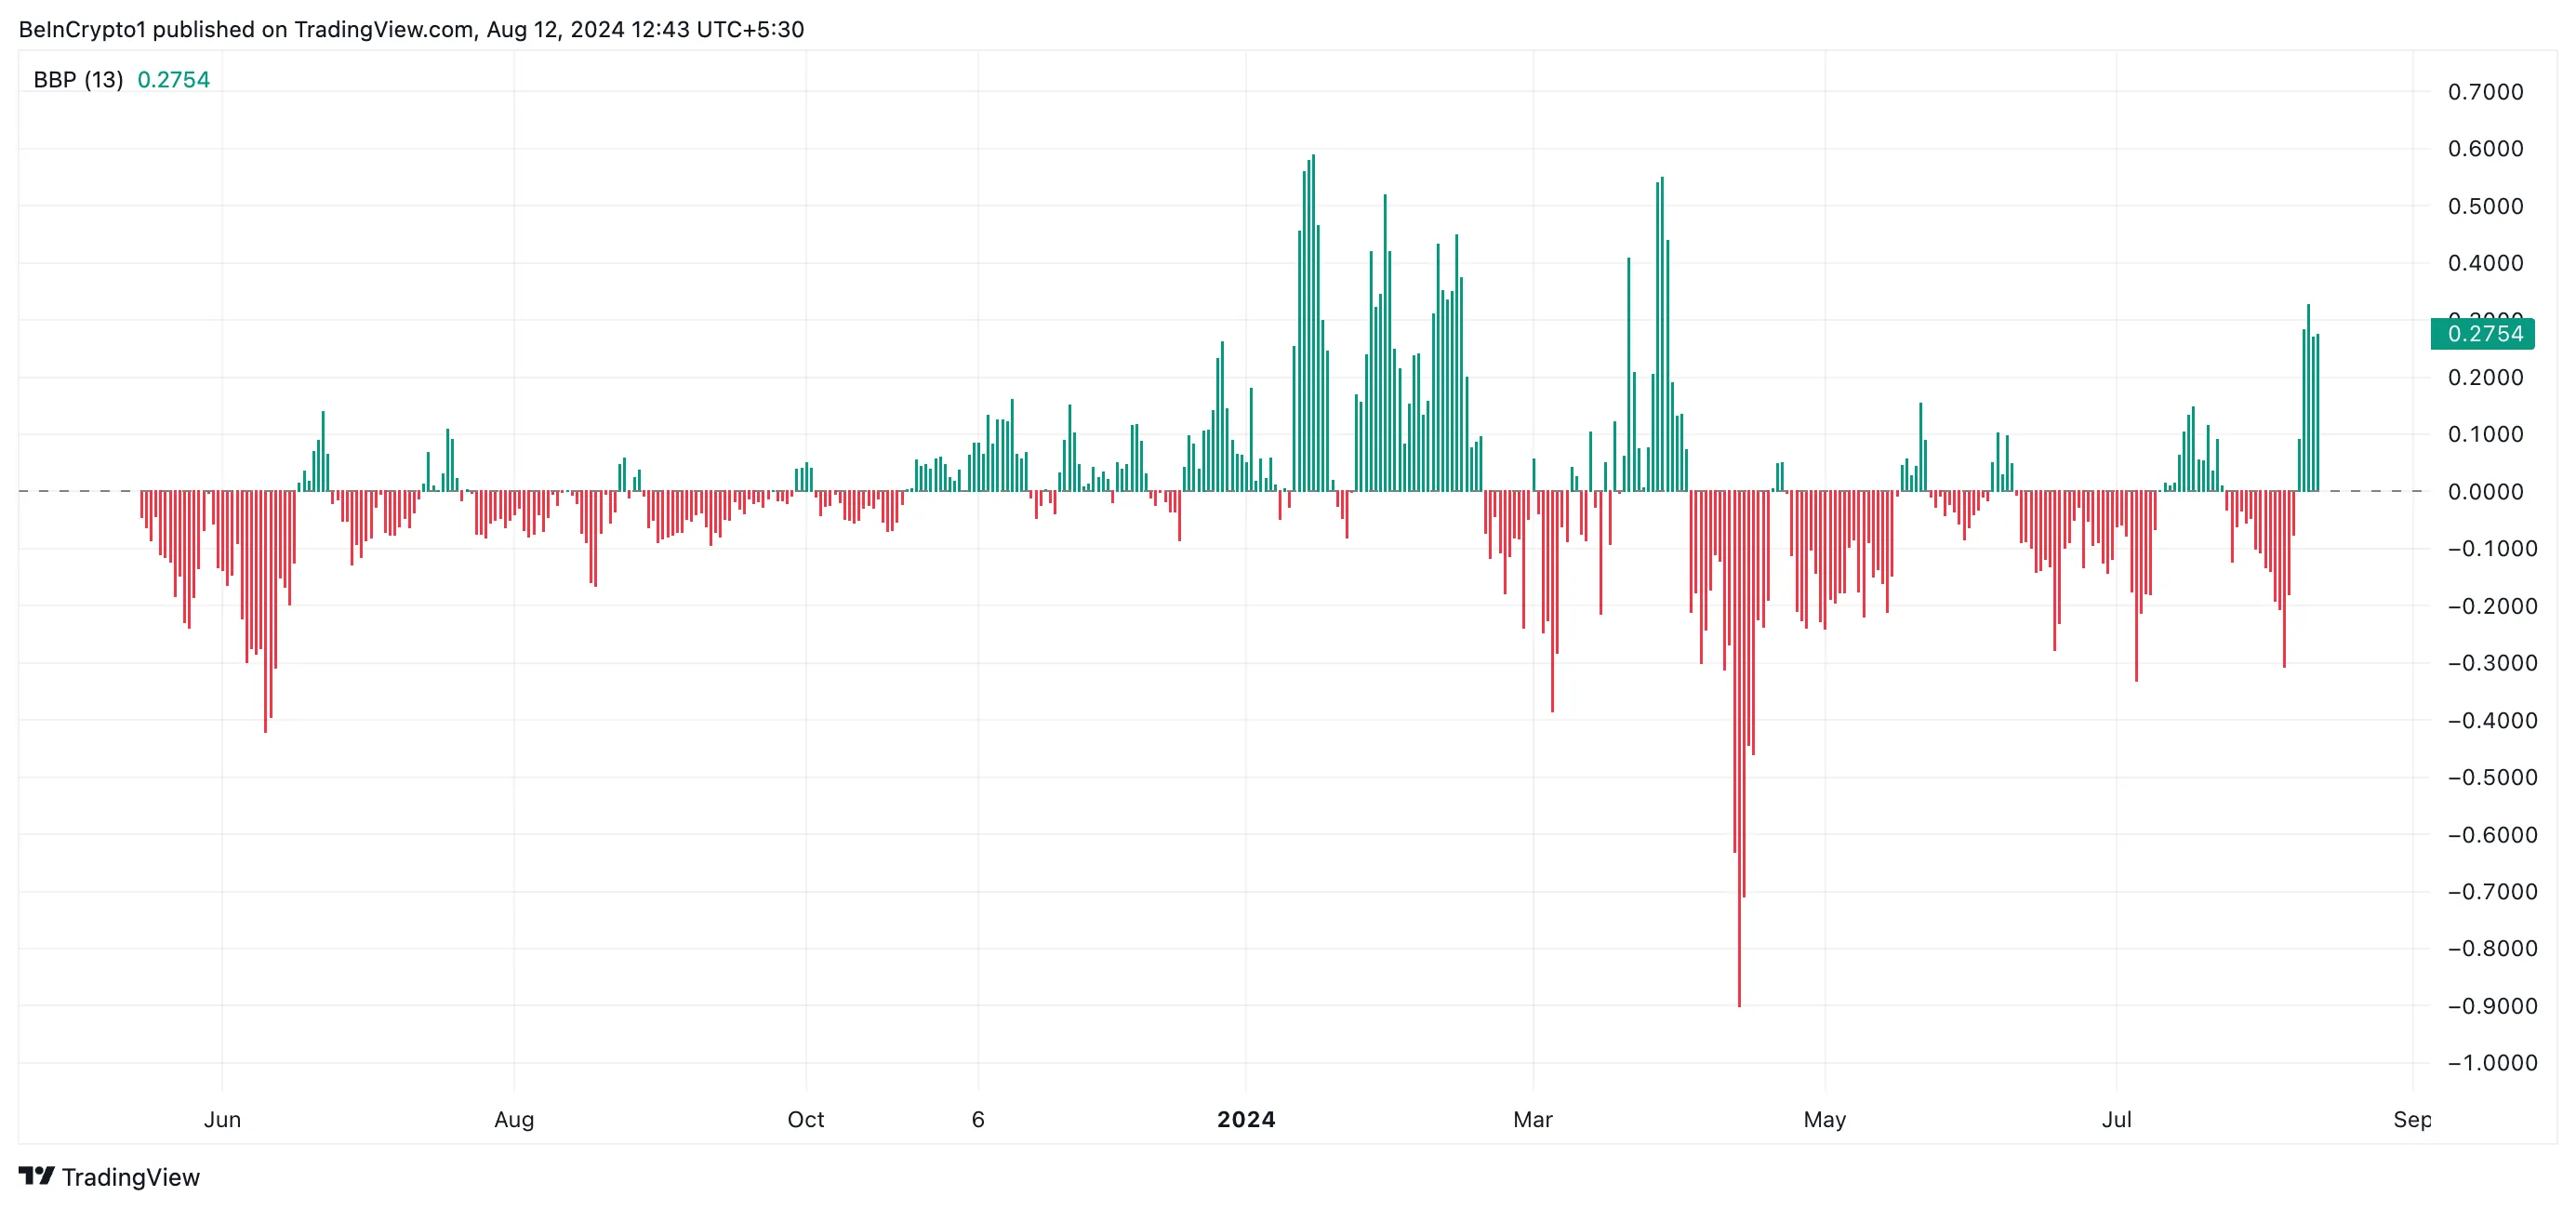
SUI’s Elder-Ray Index has returned a positive value since August 8. As of this writing, the indicator’s value is 0.27.

An asset’s Elder-Ray Index measures the strength of bulls and bears in the market. When its value is above zero, it indicates that bullish activity is stronger than bearish pressure. It suggests that buyers have control over the market and hints at the possibility of a continued price rally.
SUI’s next price target is $1.12, a level it last traded at on June 8. This will only occur if the demand for the coin is sustained and the bullish bias toward it continues to grow.
Read More: Which Are the Best Altcoins To Invest in August 2024?

However, any spike in profit-taking activity can cause a price decline. If this happens, the altcoin’s value may drop to $0.46, marking the second time since November 2023.
Disclaimer
In line with the Trust Project guidelines, this price analysis article is for informational purposes only and should not be considered financial or investment advice. BeInCrypto is committed to accurate, unbiased reporting, but market conditions are subject to change without notice. Always conduct your own research and consult with a professional before making any financial decisions. Please note that our Terms and Conditions, Privacy Policy, and Disclaimers have been updated.


Be the first to comment